Municipalities and civil protection
They find out from a phone call, when the fire has already spread.
A console with verified hotspots to activate the protocol in time.
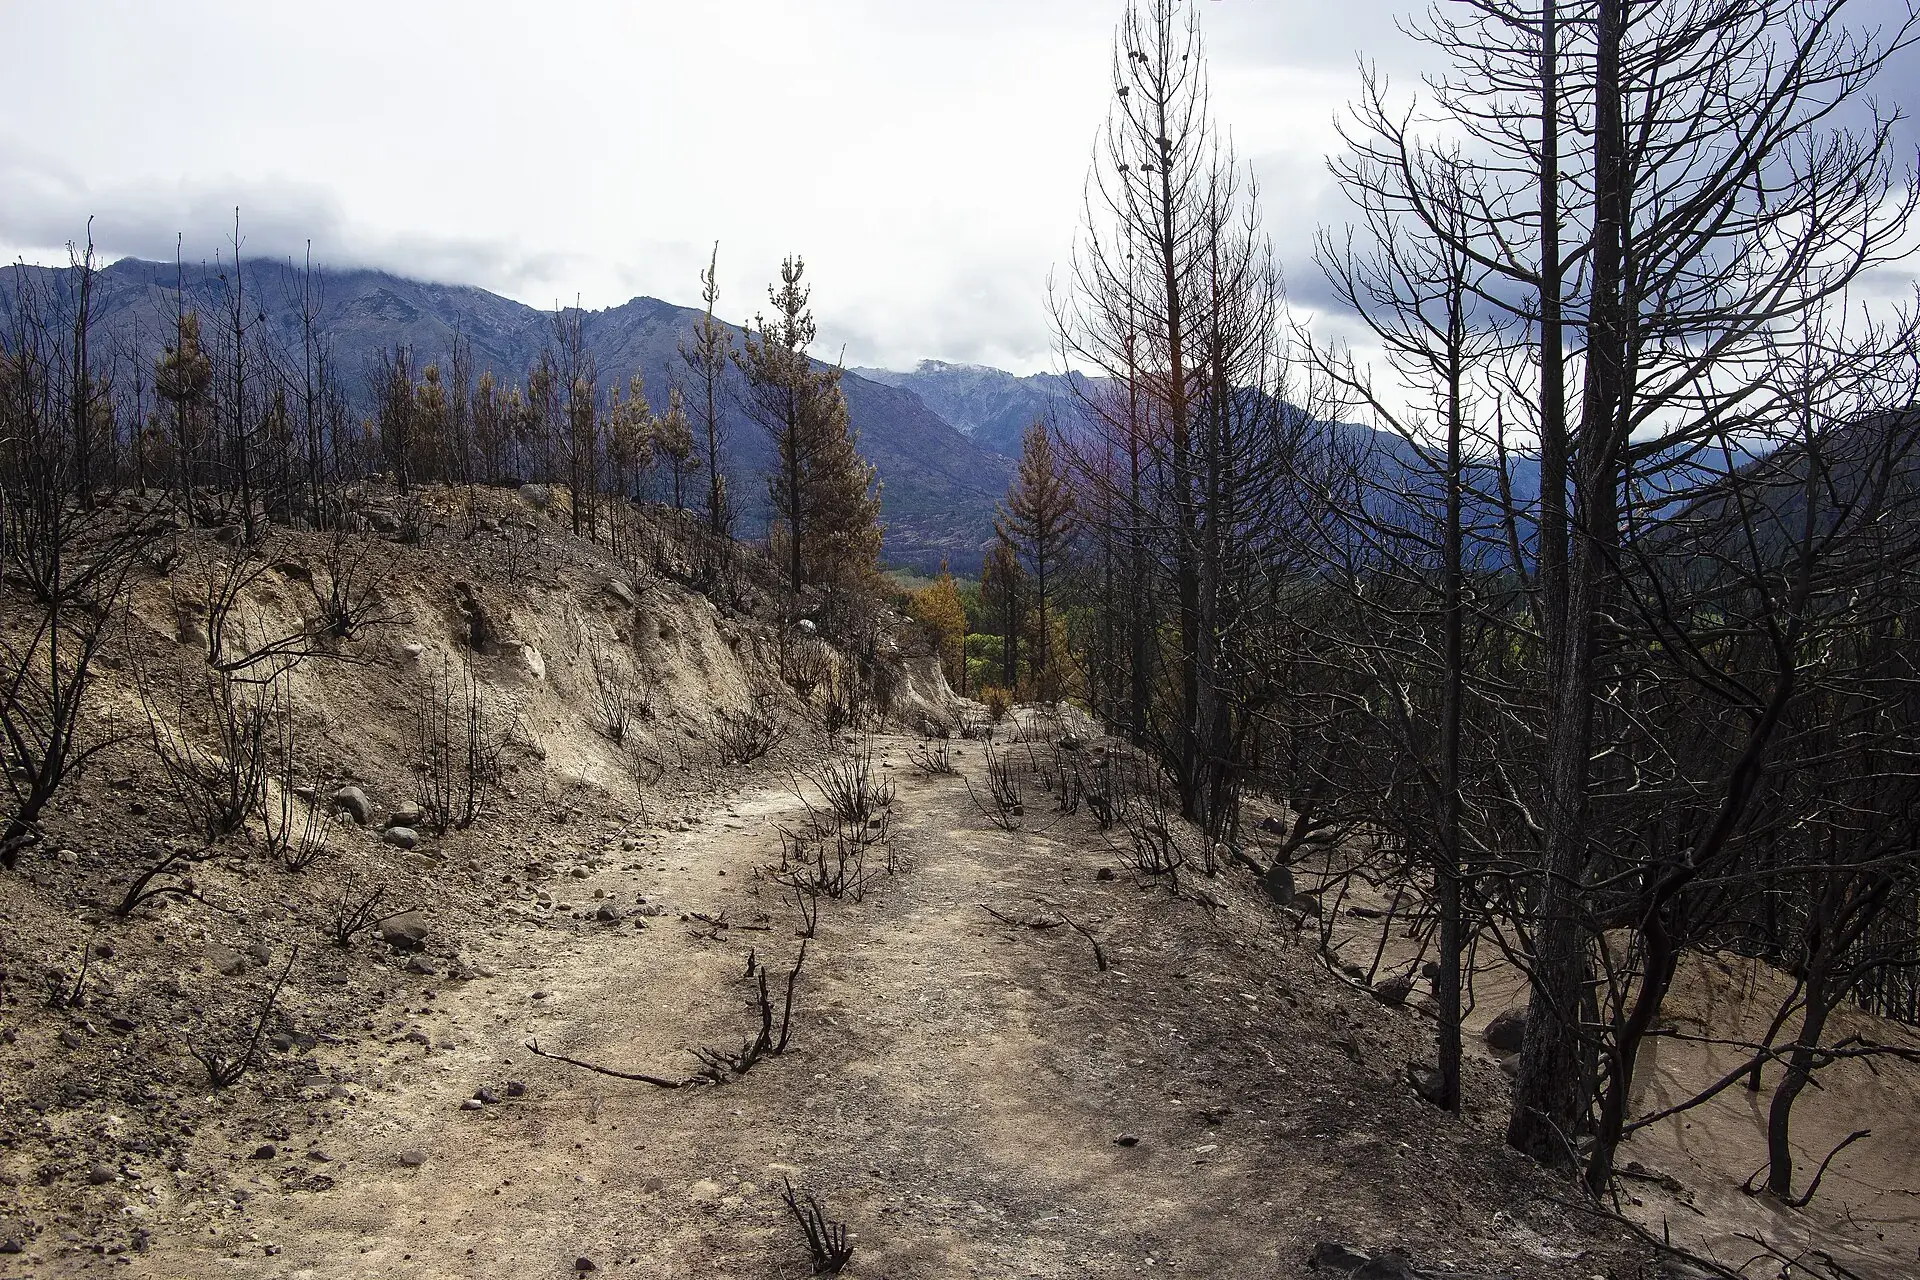
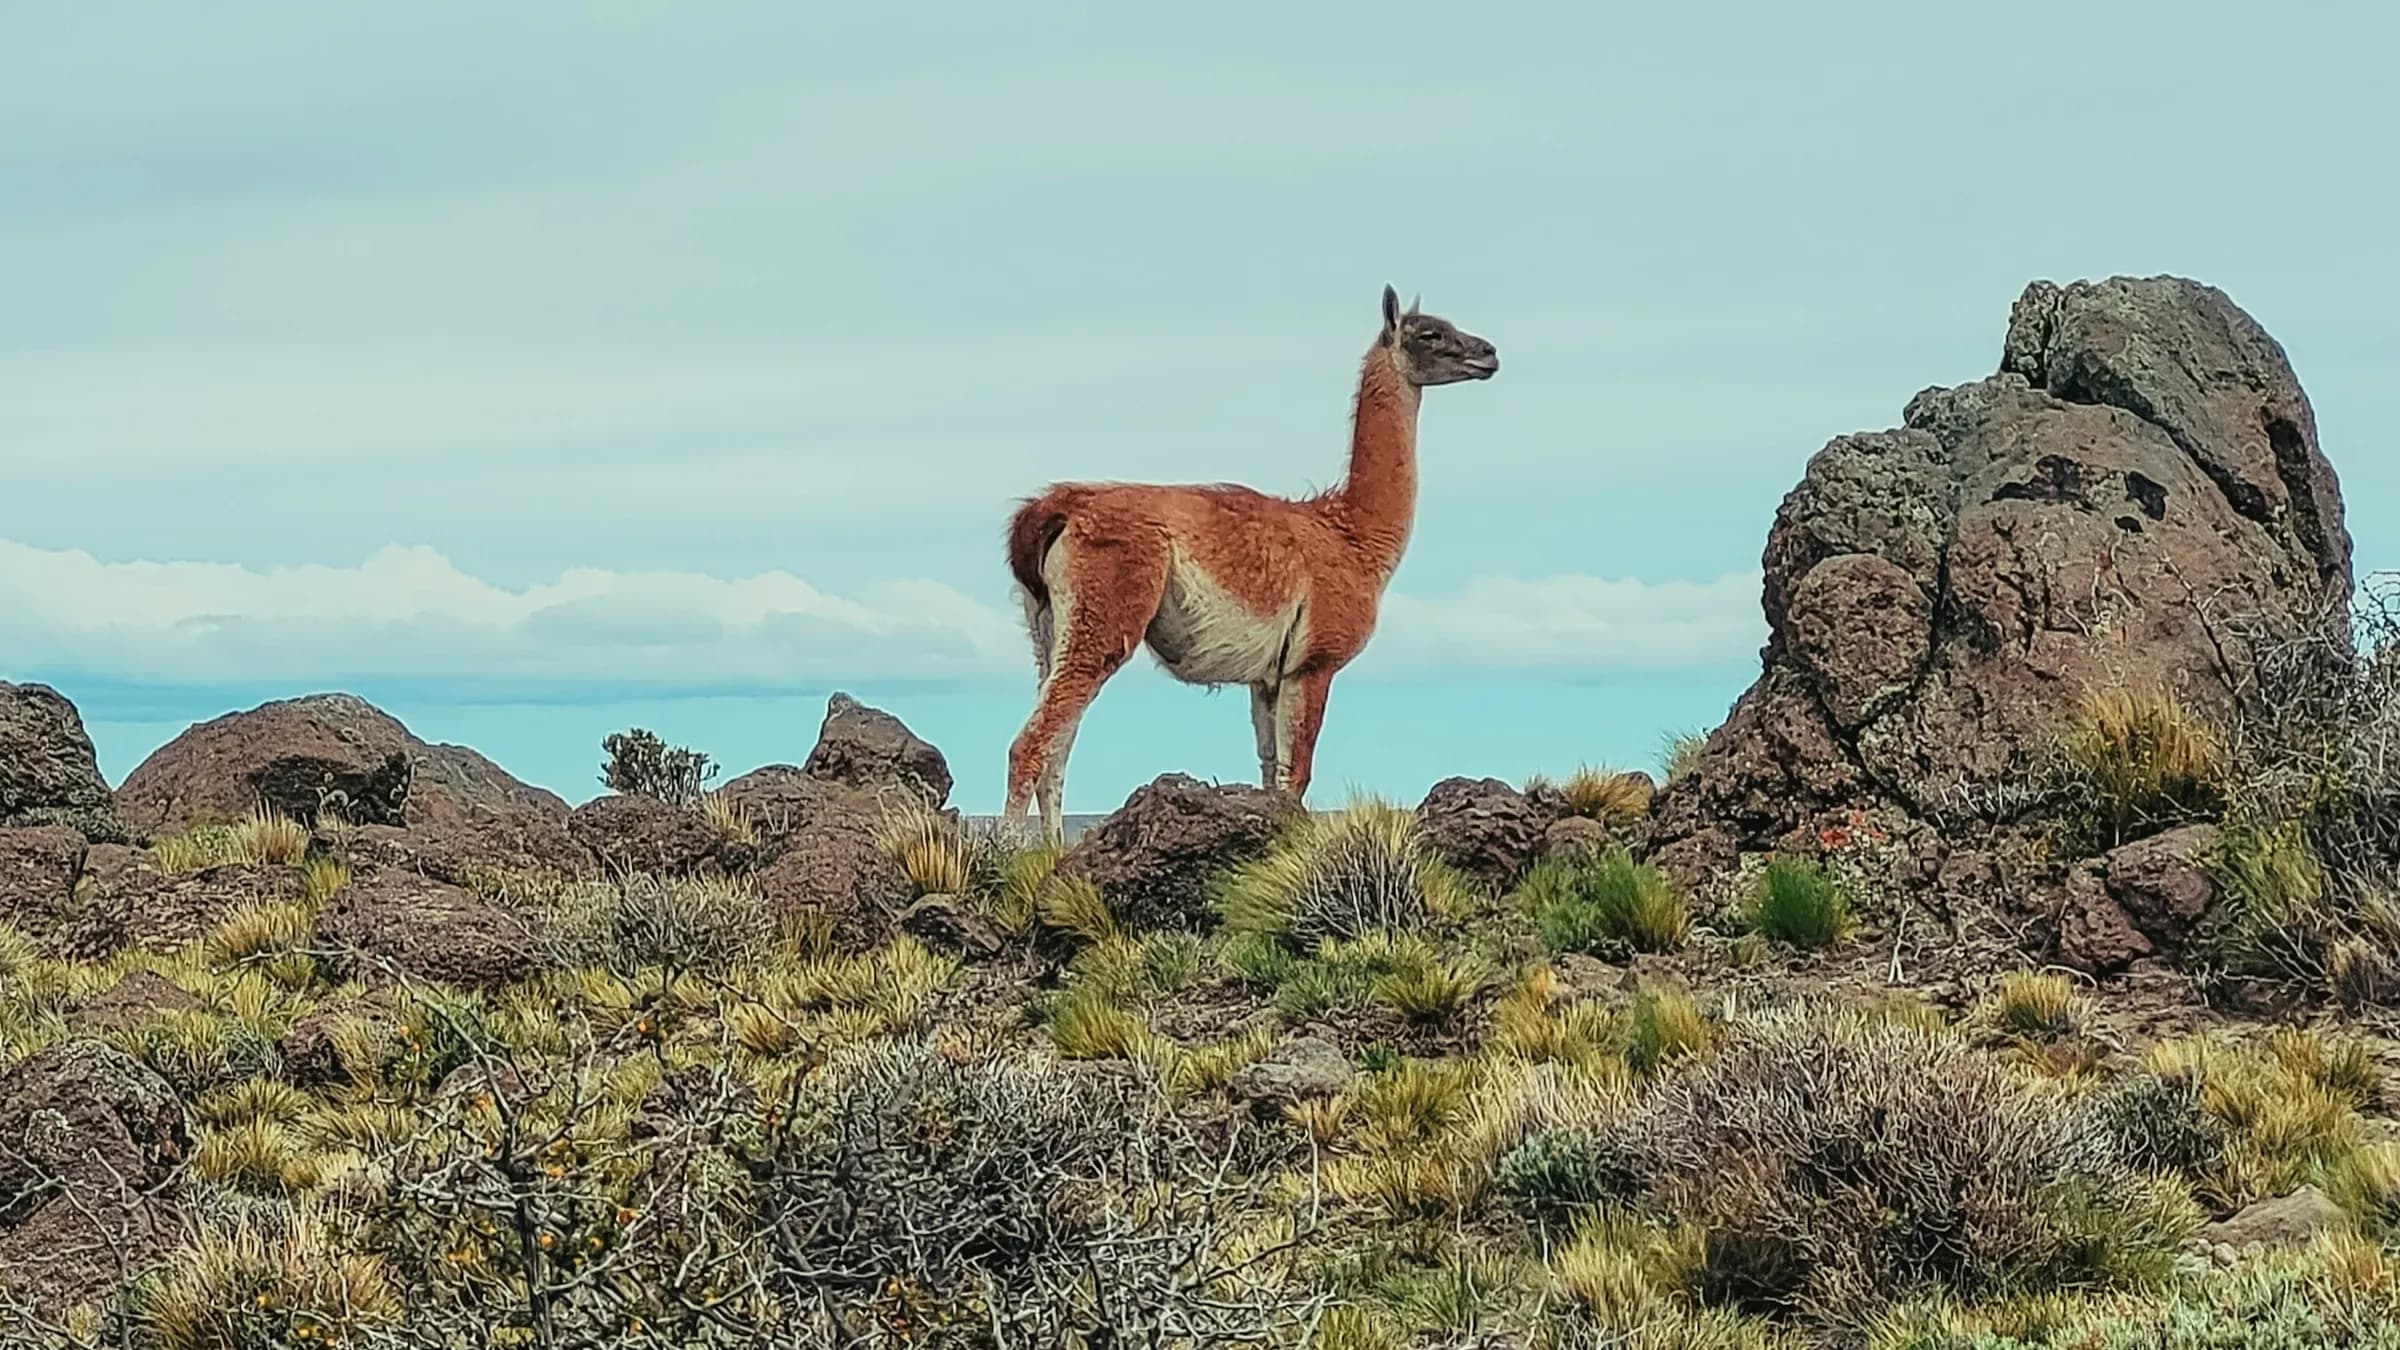
Request a pilotPhoto: CatrielGB · CC BY-SA 4.0
Sentinel reads the satellites and sends a WhatsApp alert with location and access to whoever has to act. For municipalities, fire brigades and producers across Patagonia. All from the cloud, nothing to install.
What Sentinel does
We read the fire hotspots that satellites (NASA FIRMS and GOES-19) see over the Patagonian Andes.
We cross-check the sources and rule out industrial heat before alerting anyone.
We send a WhatsApp alert with location and access. Target: 8 minutes from detection.
Everything runs in the cloud, no equipment to install. We are running an open pilot today: there are no published cases with measured results yet.
The problem
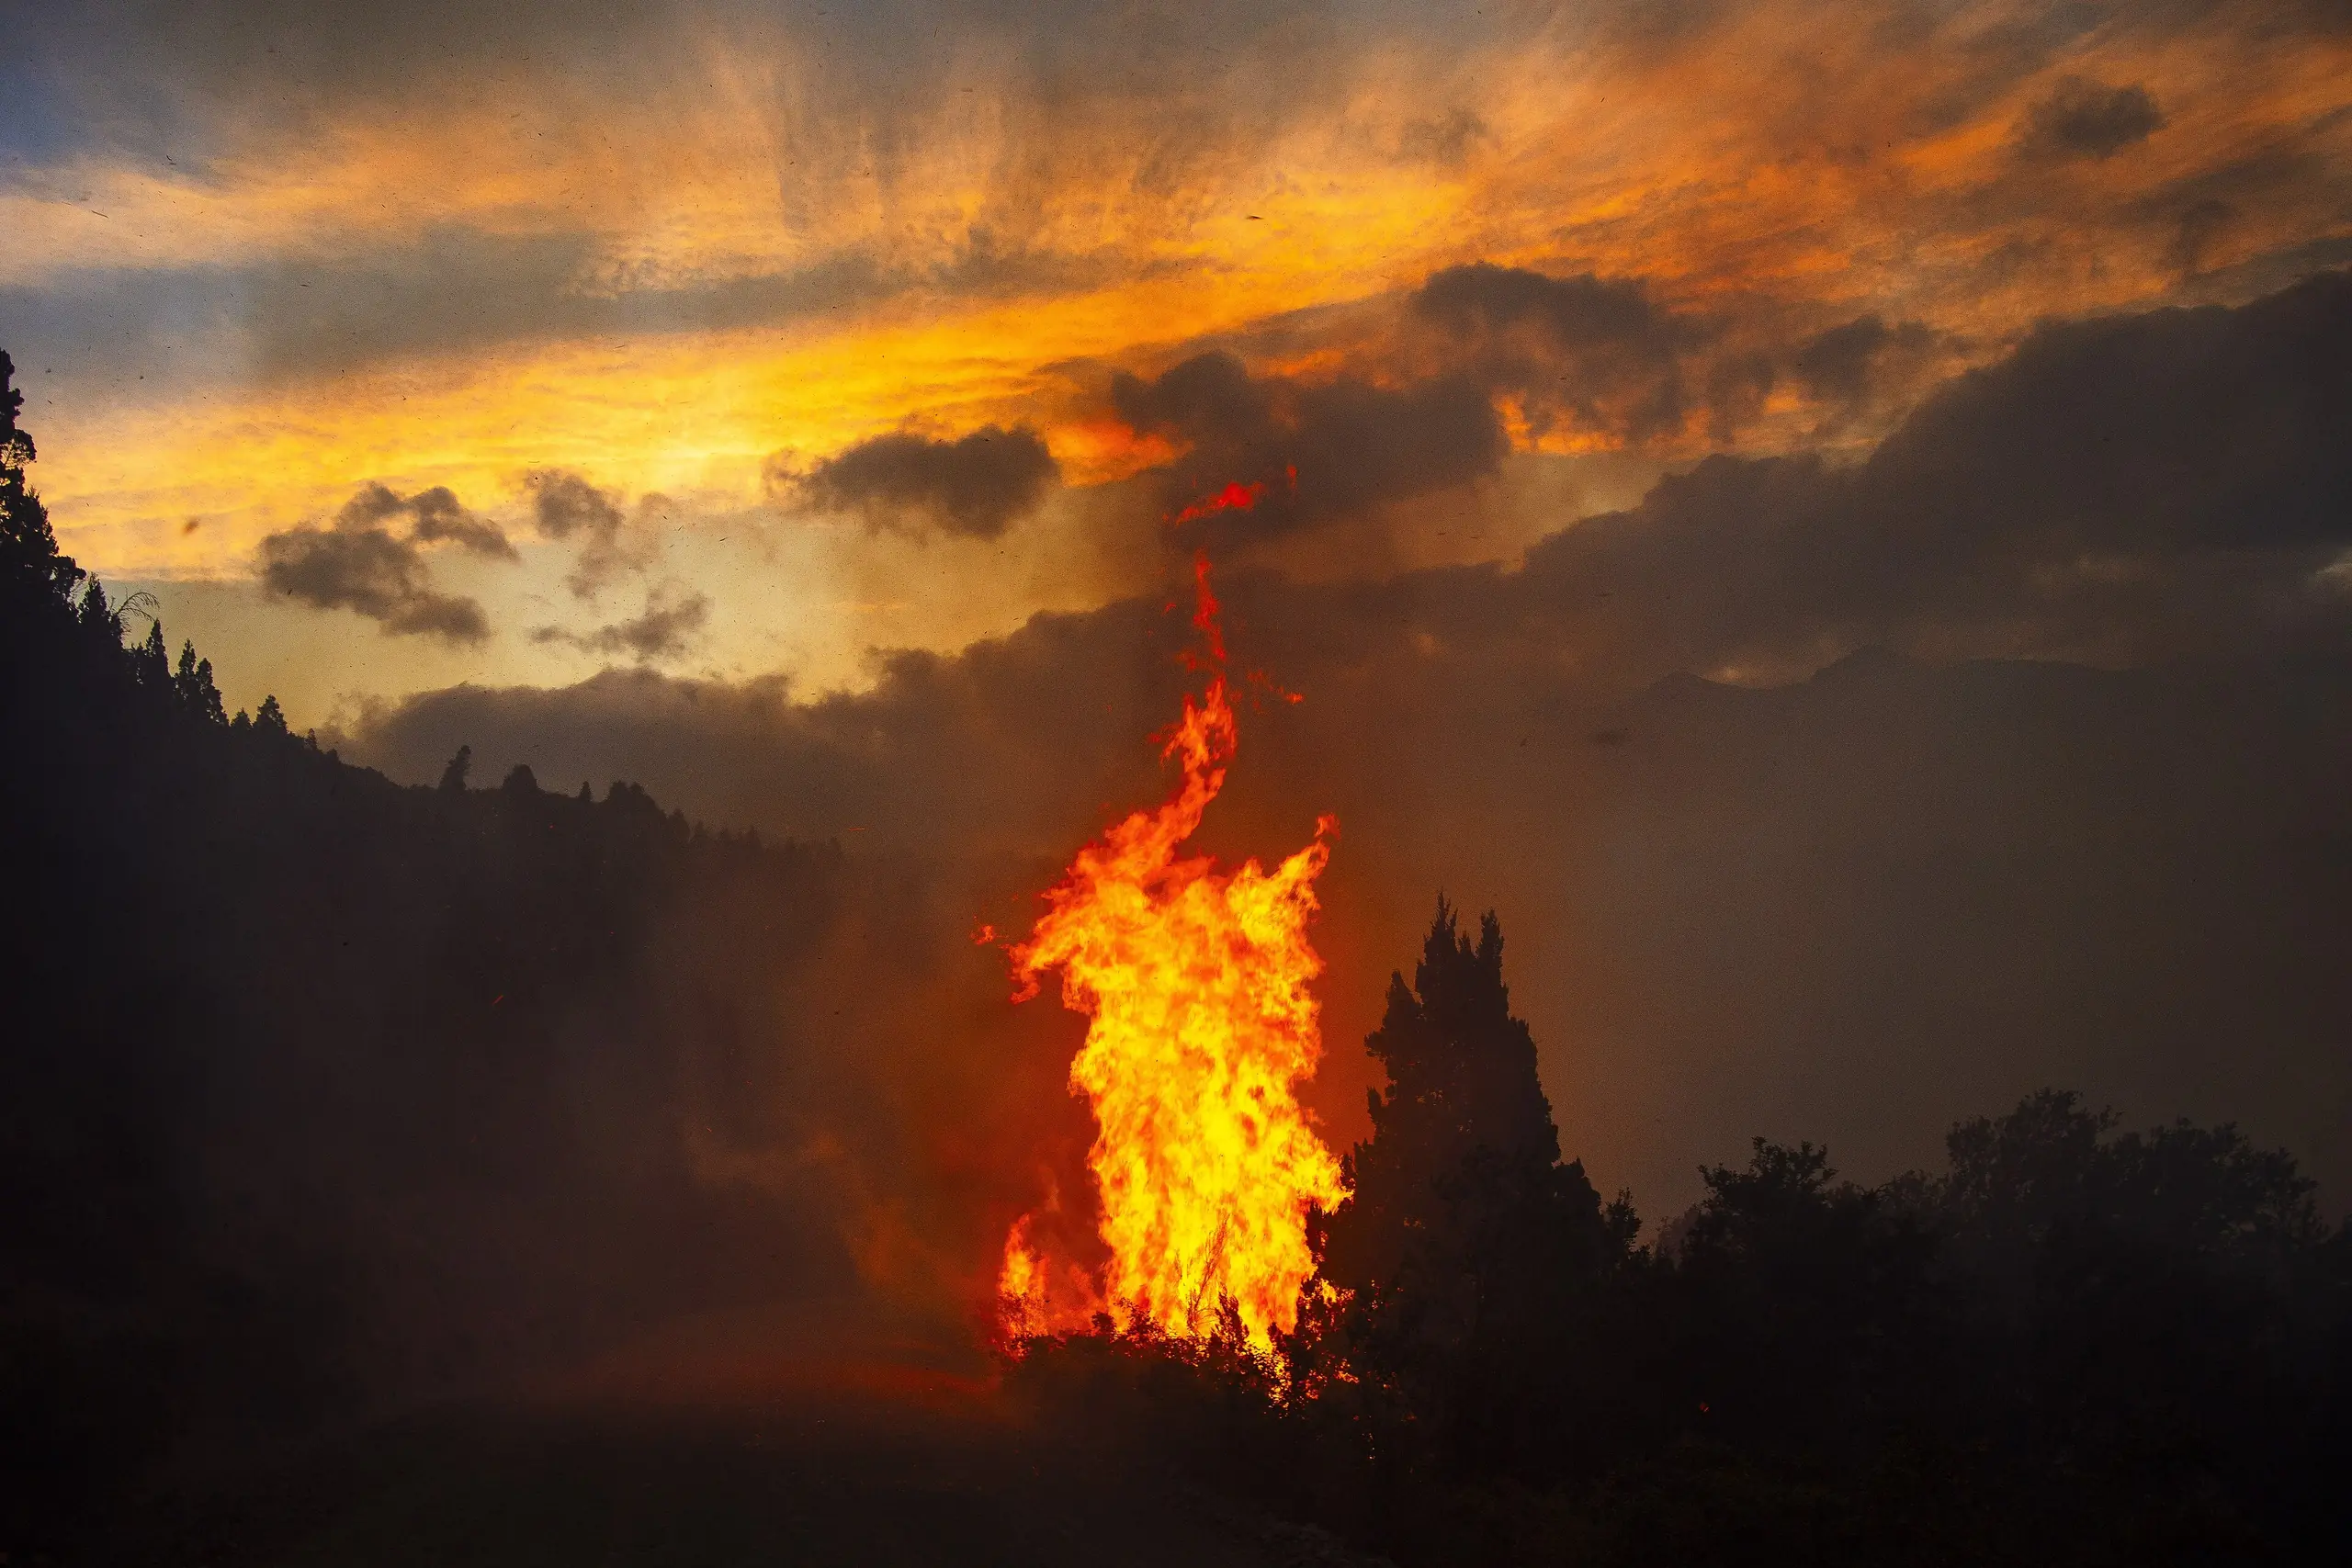
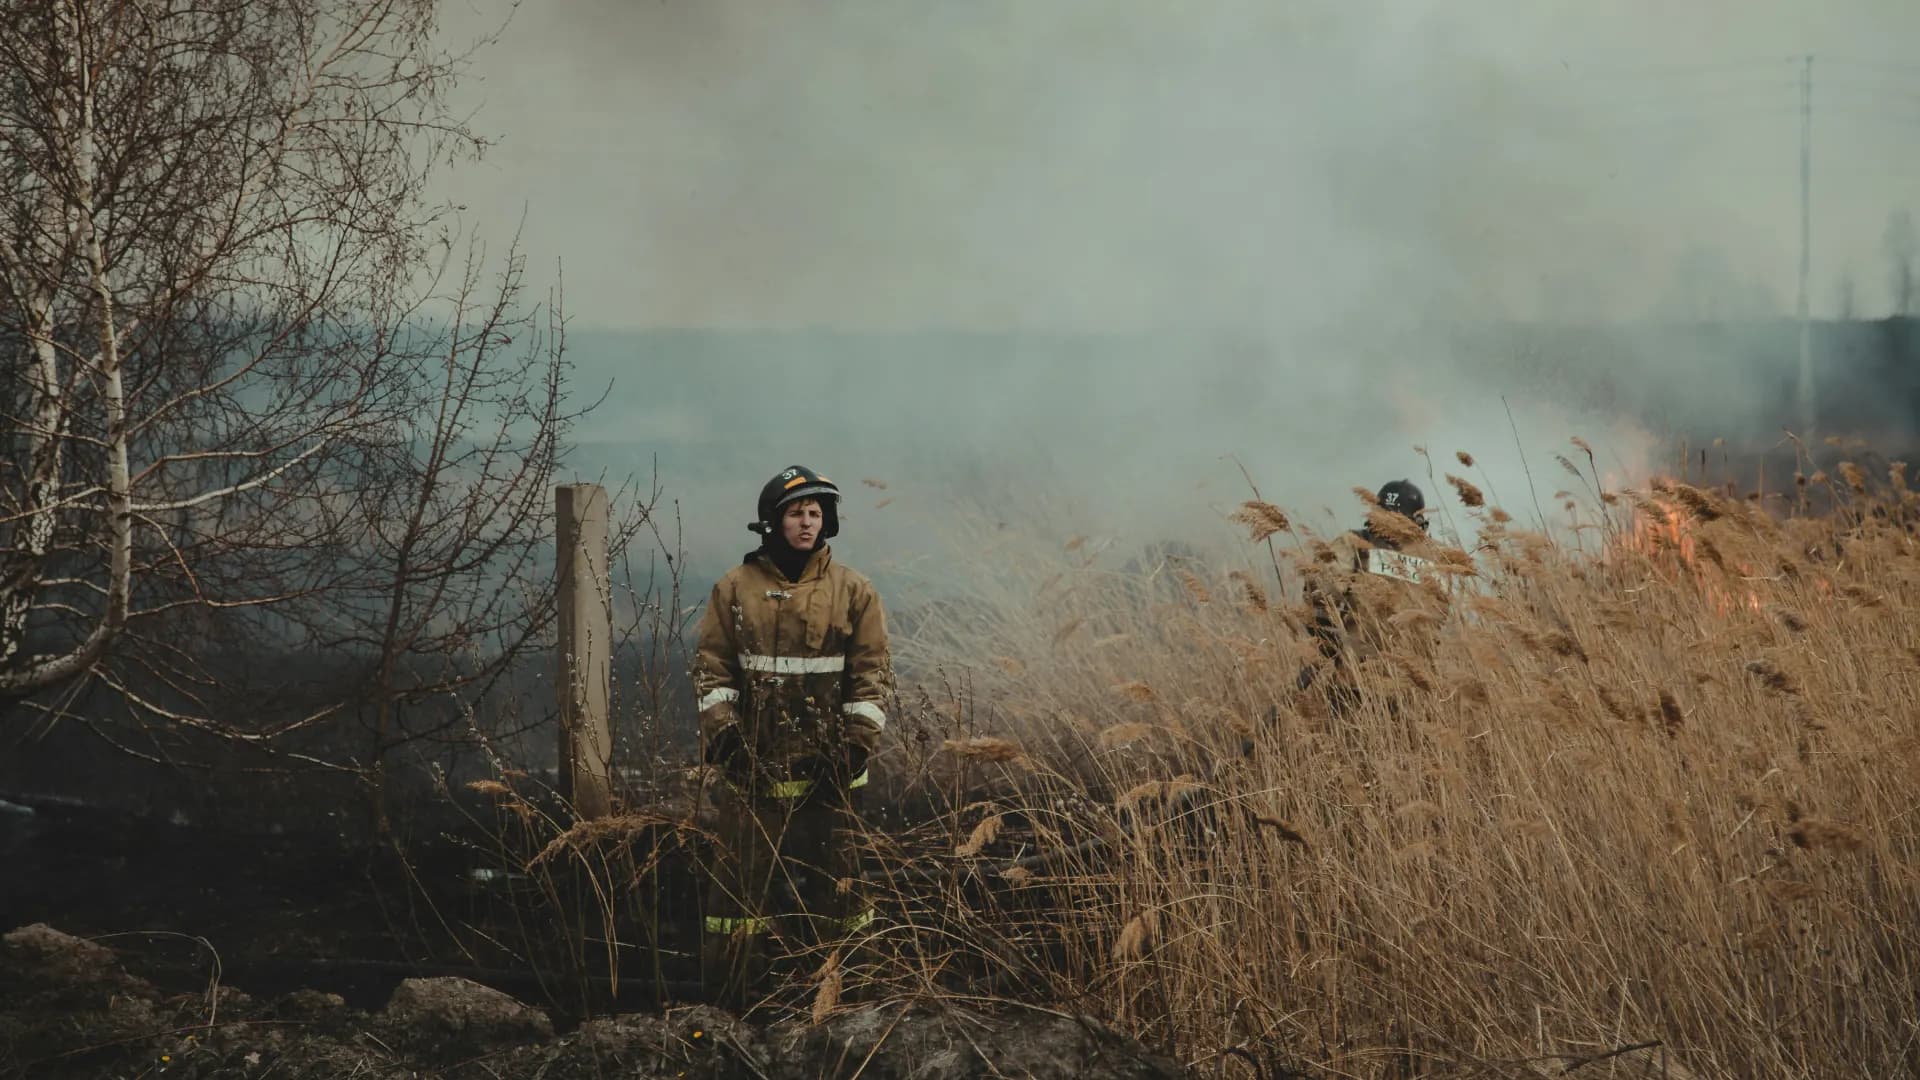
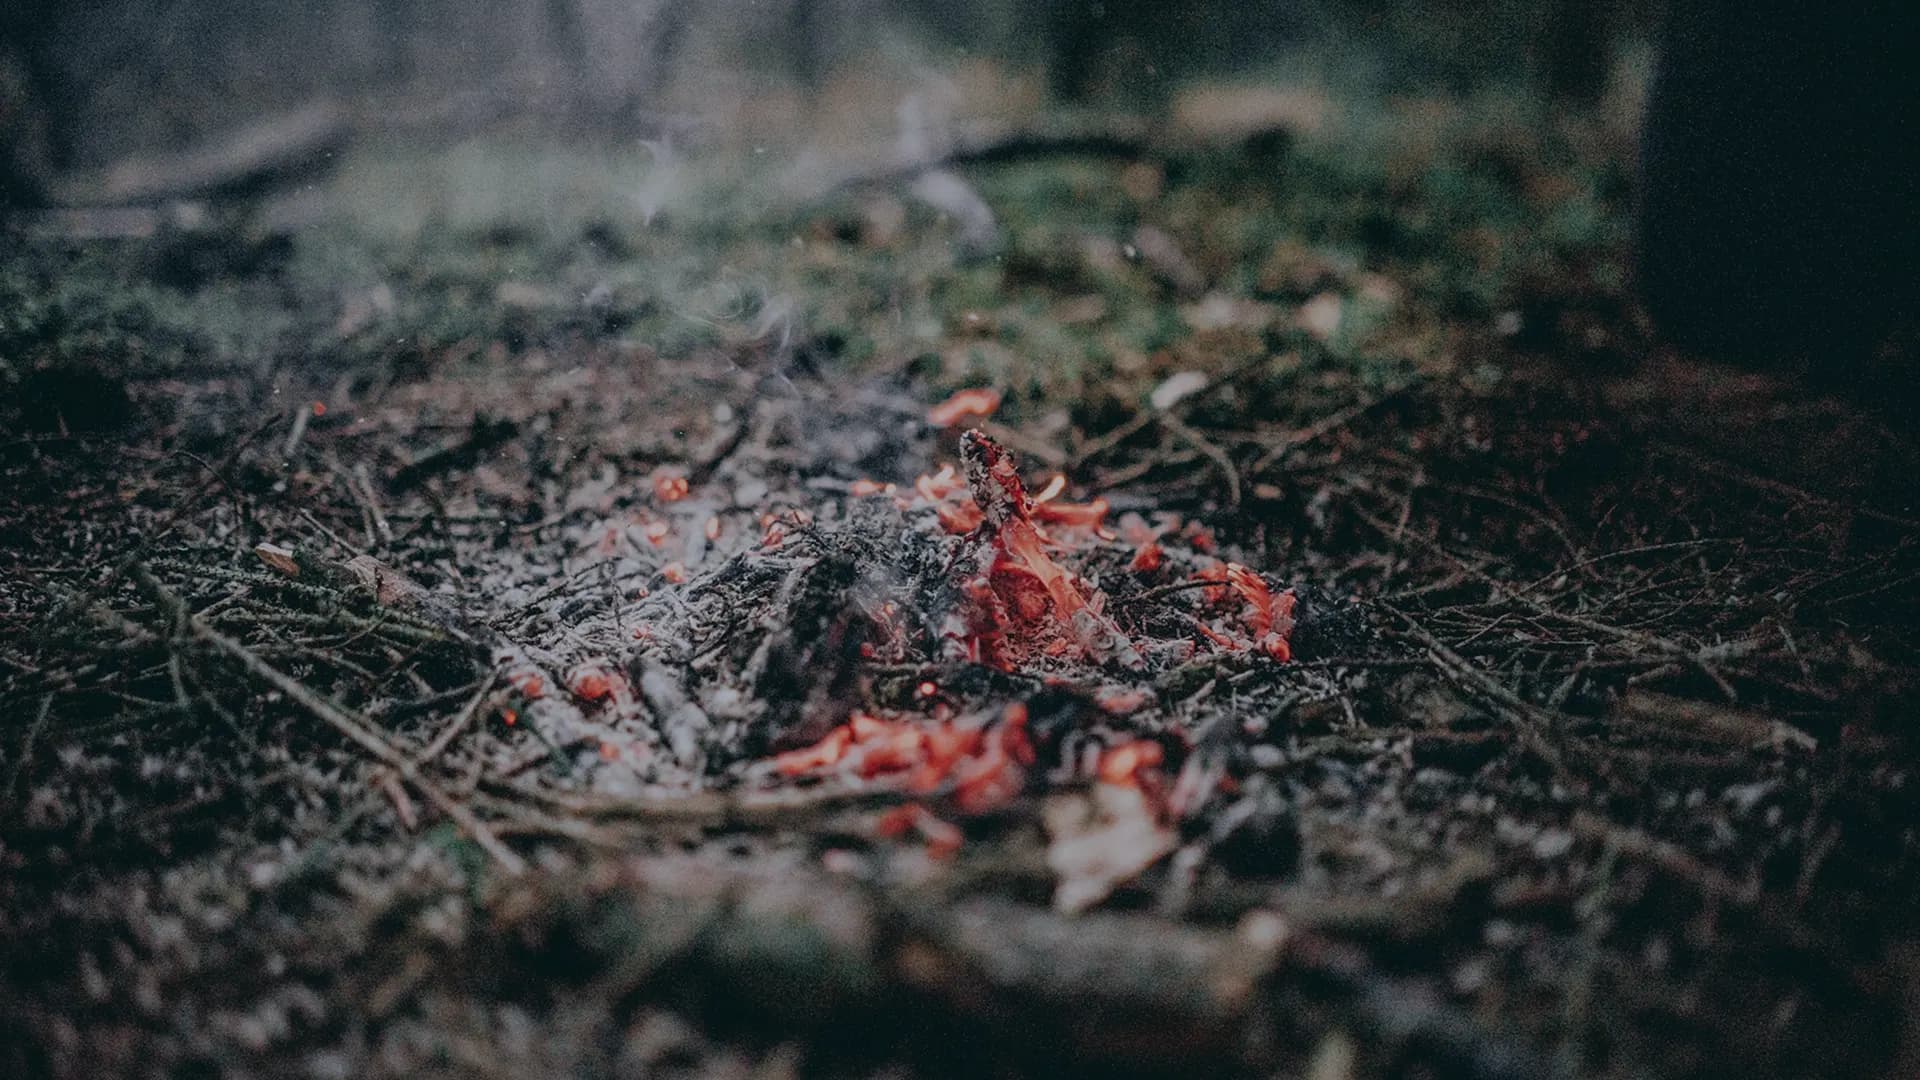
Active fire hotspot in Patagonia, January 2026. Photo: CatrielGB · CC BY-SA 4.0
Almost every big wildfire starts small: in the first minutes, a crew and a pump are enough.
In the mountains and the steppe there are almost never witnesses: the fire is noticed when the smoke column is already visible from far away.
If the brigade arrives early, it works on a small perimeter. Our goal is to alert it within 8 minutes.
What is at stake

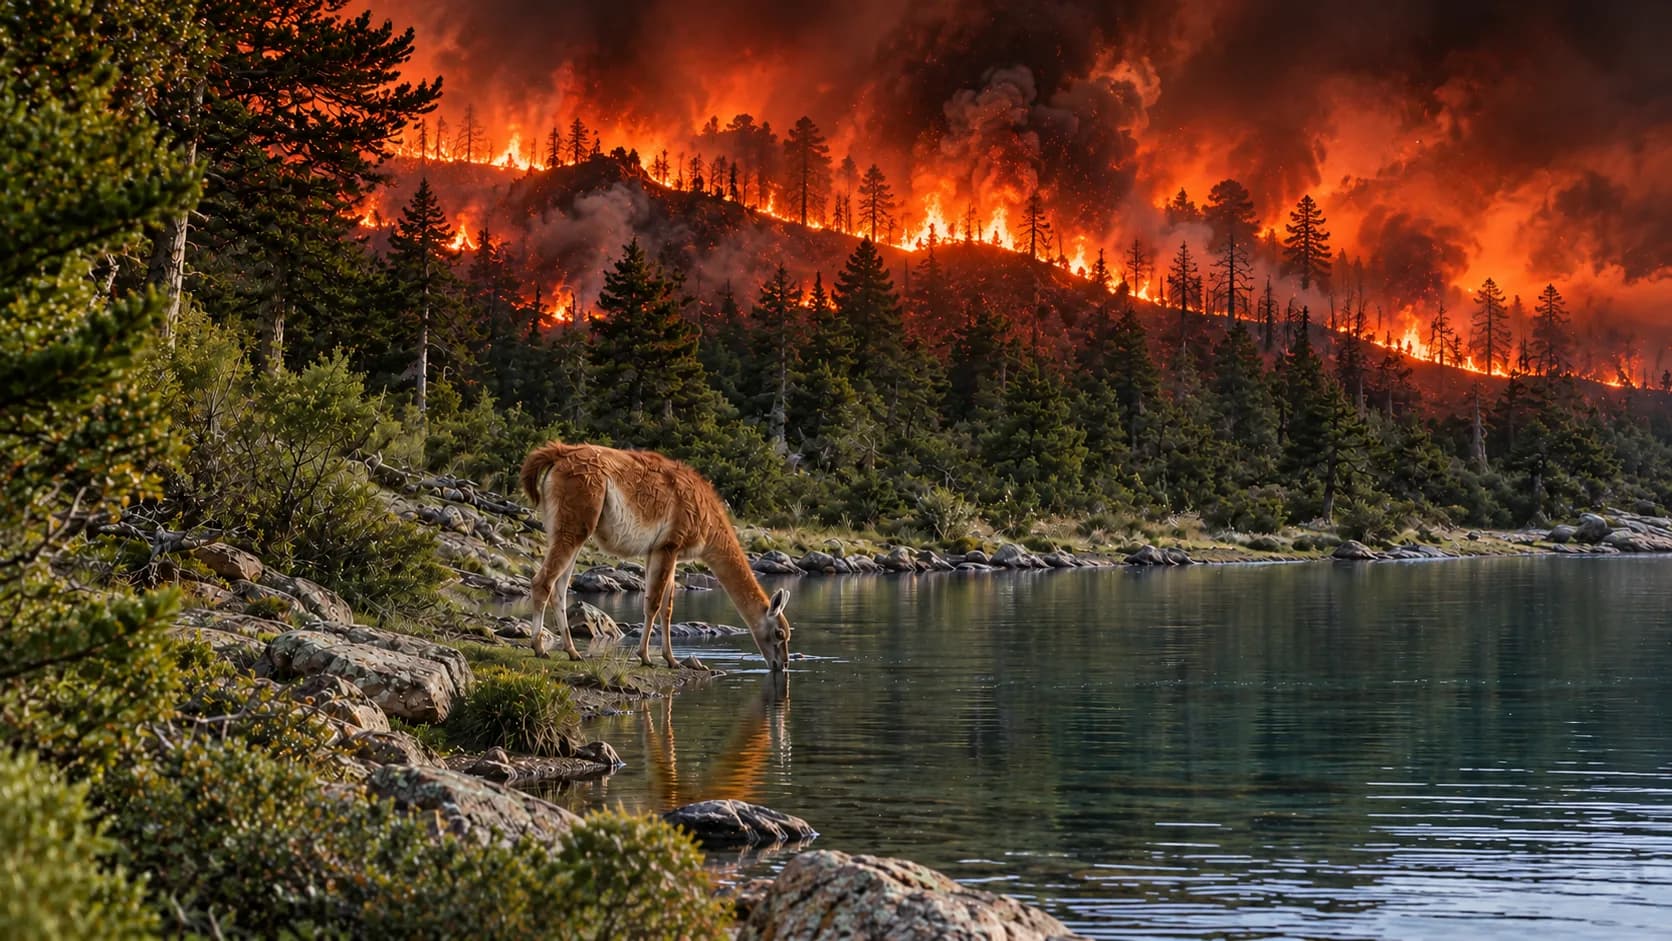
How it works
We read the fire hotspots that satellites see (VIIRS and MODIS via NASA FIRMS; GOES-19 as early warning).

We cross-check the sources and rule out industrial heat.
We add terrain, wind and nearby towns.

We send a WhatsApp alert with location and access. Target: 8 minutes from detection (not yet measured on a real wildfire).
Reconstruction of the Puerto Patriada wildfire (January 2026) in the Sentinel dashboard, using NASA FIRMS and Sentinel-2 data.
NASA FIRMS (VIIRS NOAA-20 + NOAA-21). . A fire hotspot is not a confirmed wildfire.
| Town | Temperature, humidity and wind | Risk |
|---|---|---|
| Bariloche18 °C · 43% · 16 km/h | 18 °C · 43% · 16 km/h | Low |
| El Bolsón21 °C · 37% · 4 km/h | 21 °C · 37% · 4 km/h | Low |
| San Martín de los Andes20 °C · 49% · 14 km/h | 20 °C · 49% · 14 km/h | Low |
| Esquel19 °C · 24% · 9 km/h | 19 °C · 24% · 9 km/h | Moderate |
991 hotspots in 24 h52,144 in 90 days
Fire hotspots are preliminary satellite data, not verified on the ground, and arrive with a delay of hours. Source: NASA FIRMS (opens in a new tab) (VIIRS NOAA-20 + NOAA-21), medium or high confidence. The outline of Argentina is simplified and may be off near the border. Risk: reading 2026-11-10 11:15 (local time). Our own illustrative index (temperature, humidity and wind), not the official FWI. Weather data: Open-Meteo (opens in a new tab) (CC BY 4.0).
Who it's for
They find out from a phone call, when the fire has already spread.
A console with verified hotspots to activate the protocol in time.
Request a pilotPhoto: CatrielGB · CC BY-SA 4.0
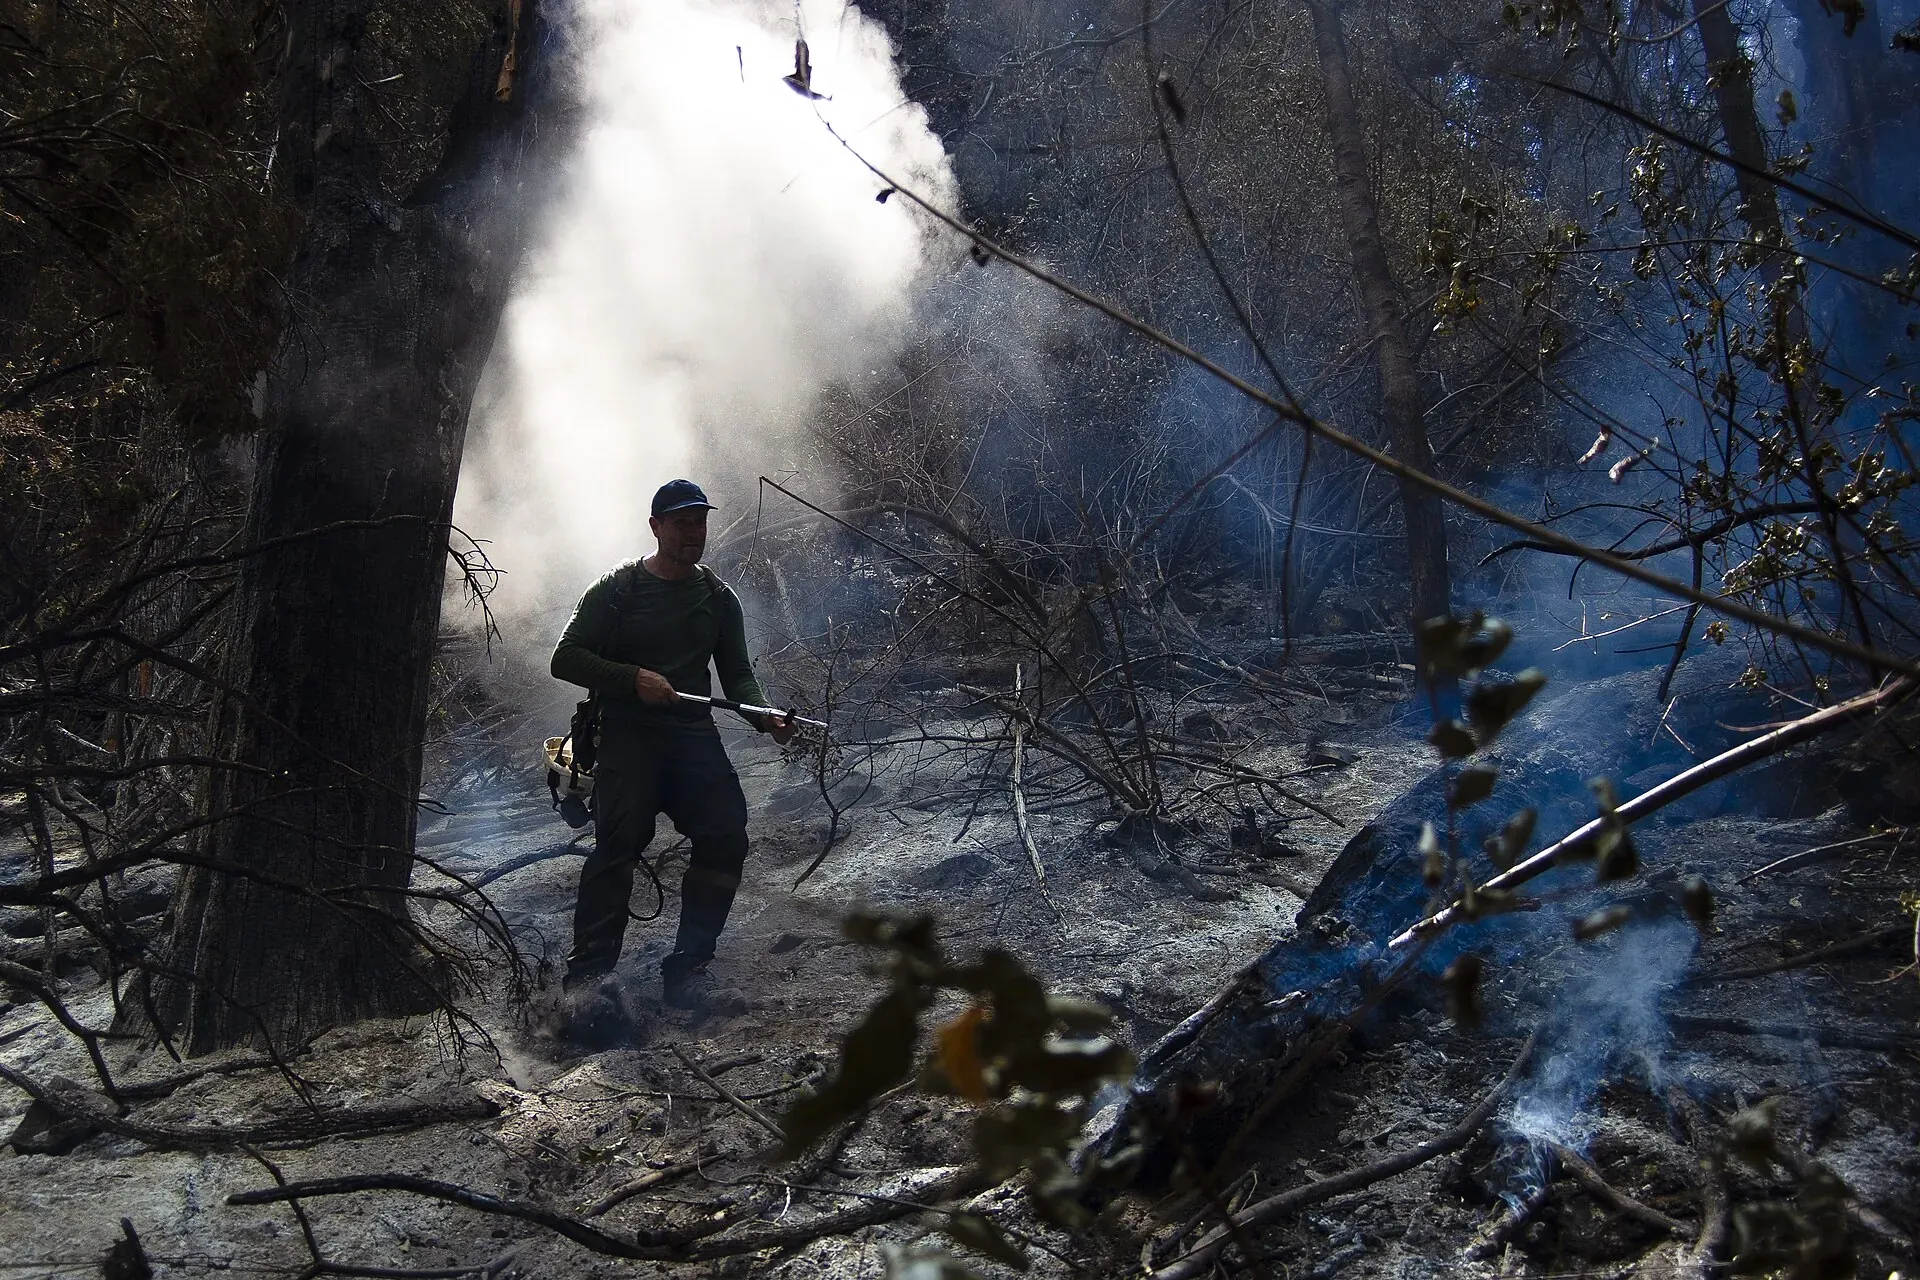
Heading out without knowing where the fire front is or which way the wind blows.
A WhatsApp alert with coordinates, wind and access, straight to the crew.
Request a pilotPhoto: CatrielGB · CC BY-SA 4.0
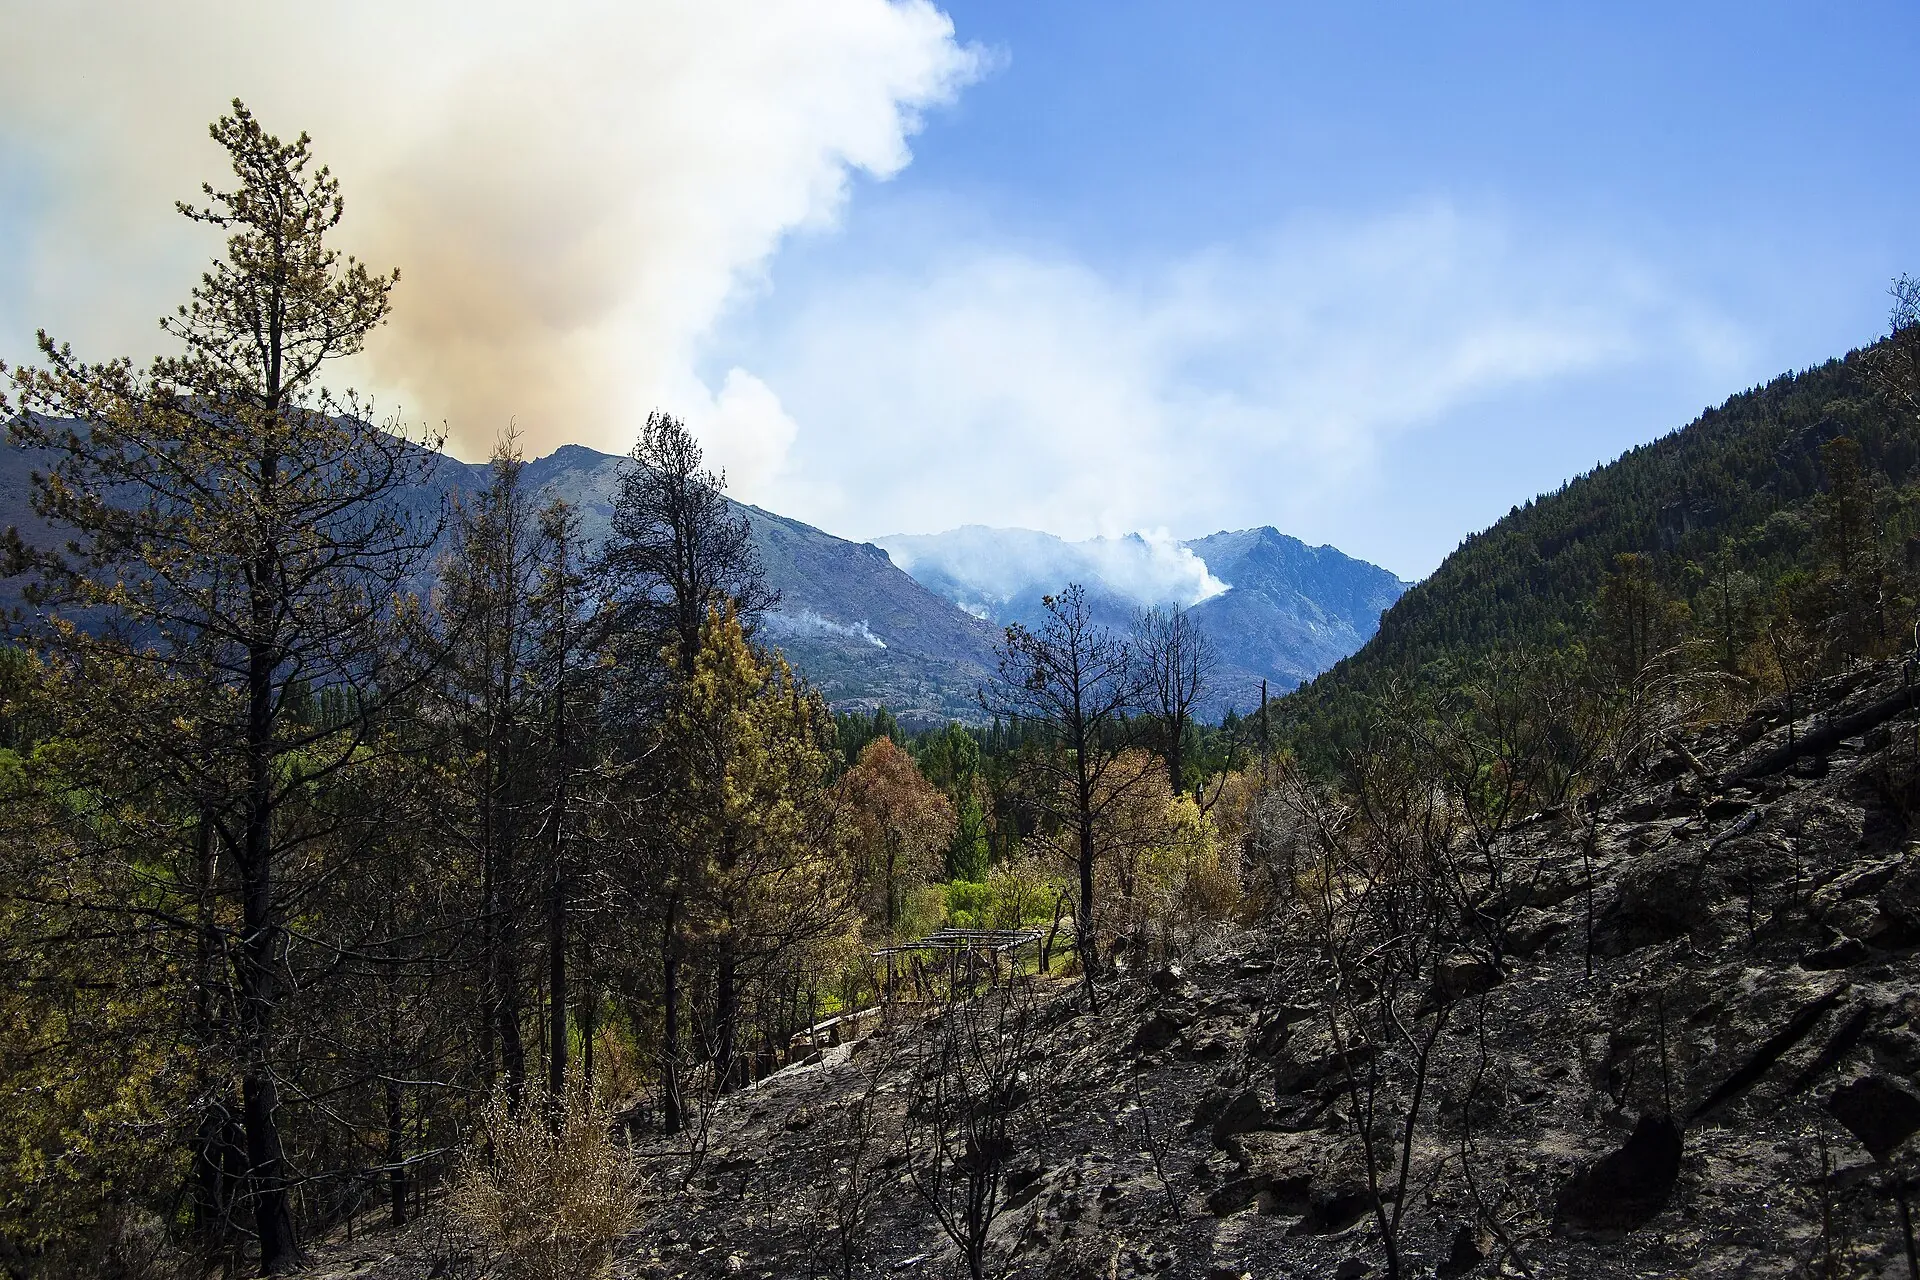
A nearby hotspot nobody spots in time puts the whole year at risk.
An early warning for your plots and a record of the event.
Request a pilotPhoto: CatrielGB · CC BY-SA 4.0
Open pilot: there are no published cases yet.
01 / 04The world
The satellites we read, NASA FIRMS and GOES-19, see every fire hotspot on the continent. Sentinel turns it into an alert for whoever has to act.
02 / 04Verify
We cross-check sources and rule out industrial heat before alerting anyone.
03 / 04Context
Before alerting, the hotspot is completed with data about the place.
Terrain, wind and locality
Added to every detected hotspot.
Location and access
Sent by WhatsApp to whoever has to act.
Target: 8 minutes
From detection; still being measured in a real wildfire.
04 / 04Patagonia
This is where we work today. If you are a municipality, a fire brigade or a producer, let's set up a pilot.
Who we are
We started Sentinel at university and we keep building it ourselves. We don't have pilots with measured results yet, so we show you who we are, what recognition the project has received and how we measure what we claim.
Recognition
2025 – 2026. Where a published article exists, the panel links to it.
01 / 062025
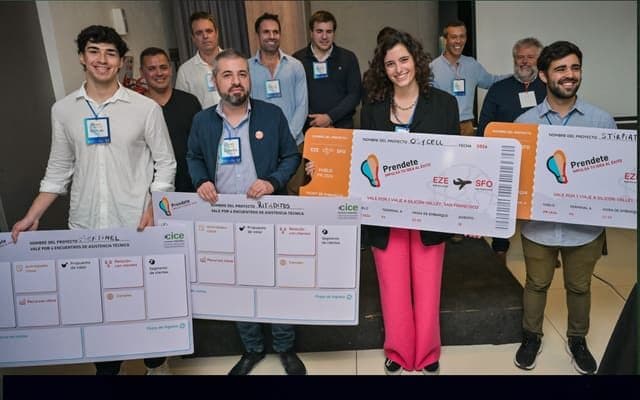
Pitch Day
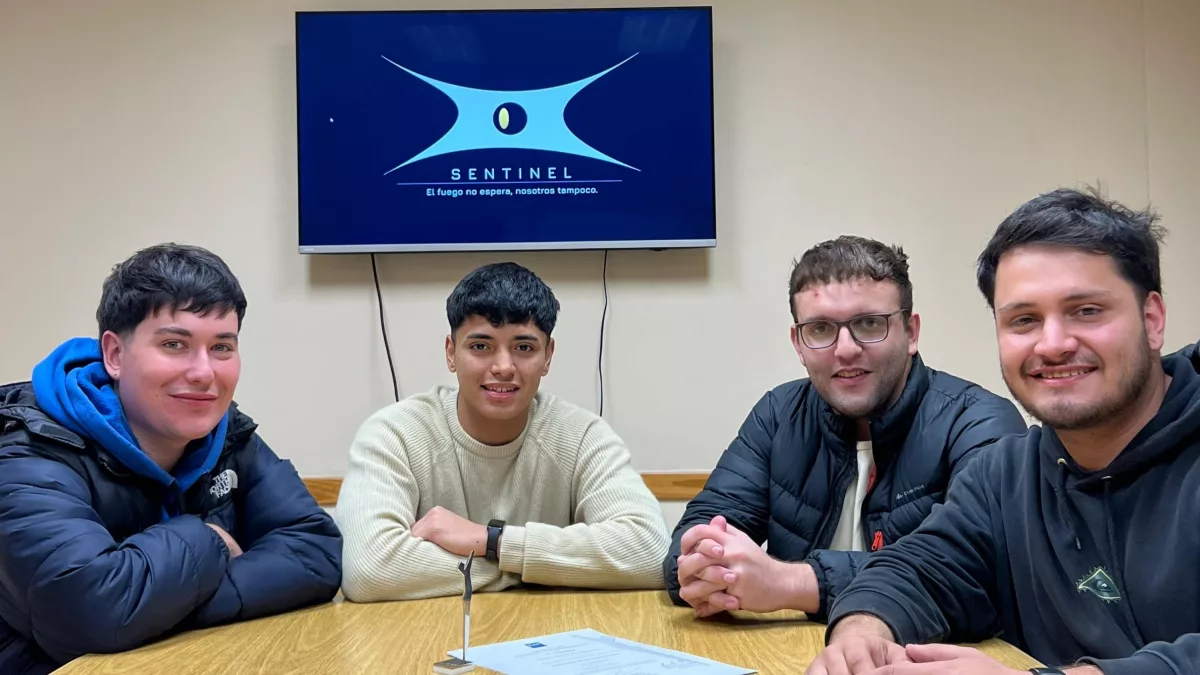
The team with the other Prendete finalist projects (Mendoza).
02 / 062025
We won
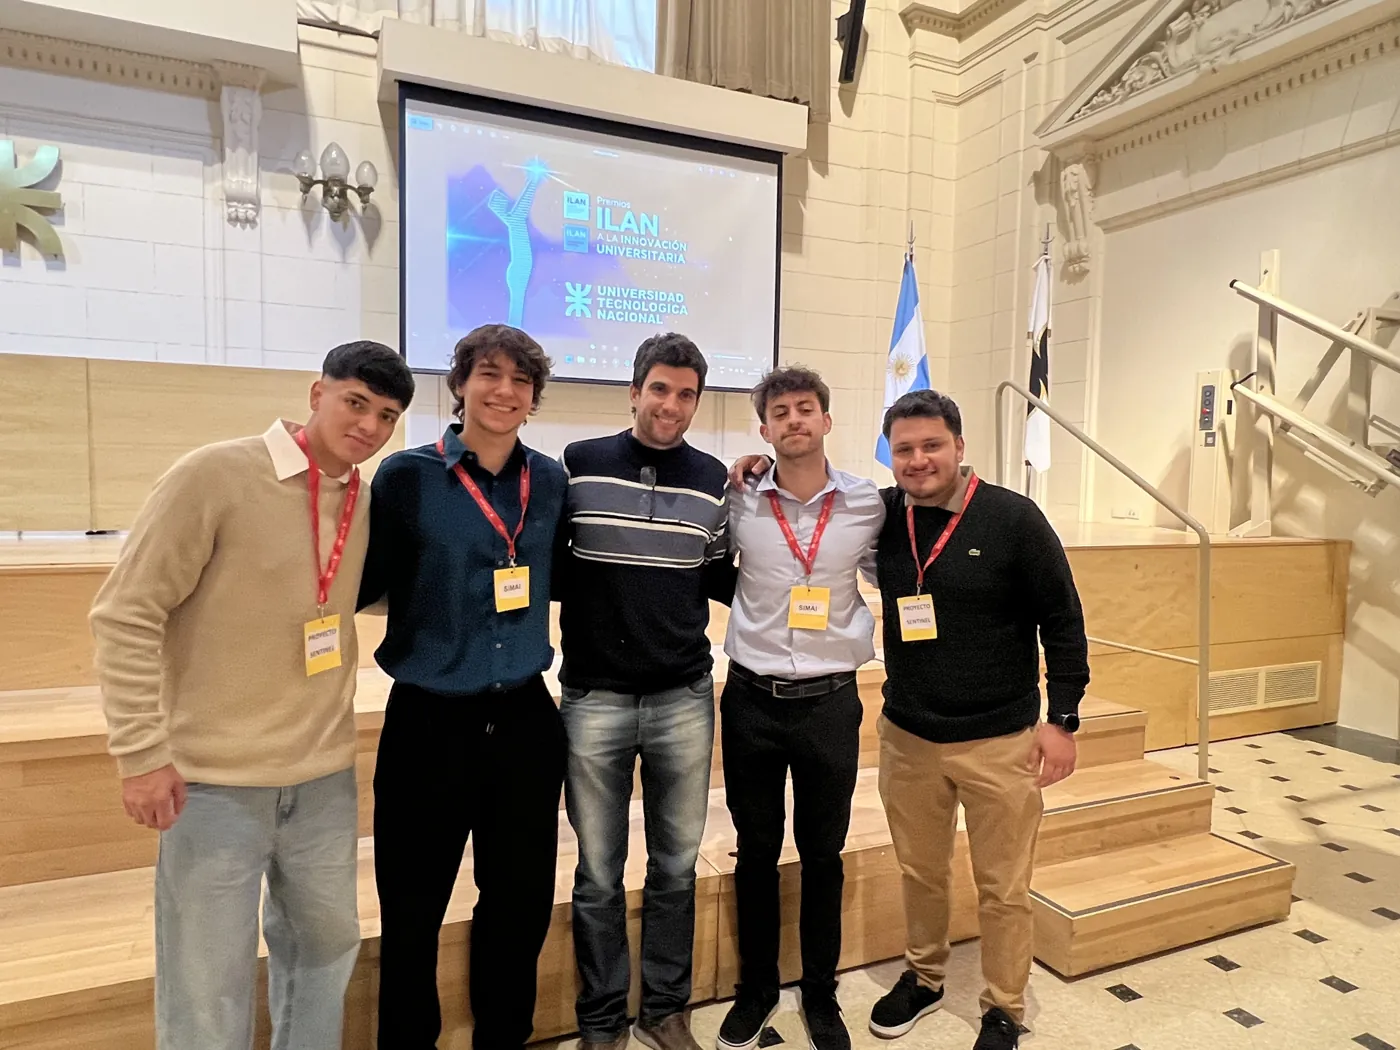
The team receives the ILAN award certificate.
Read the article (opens in a new tab)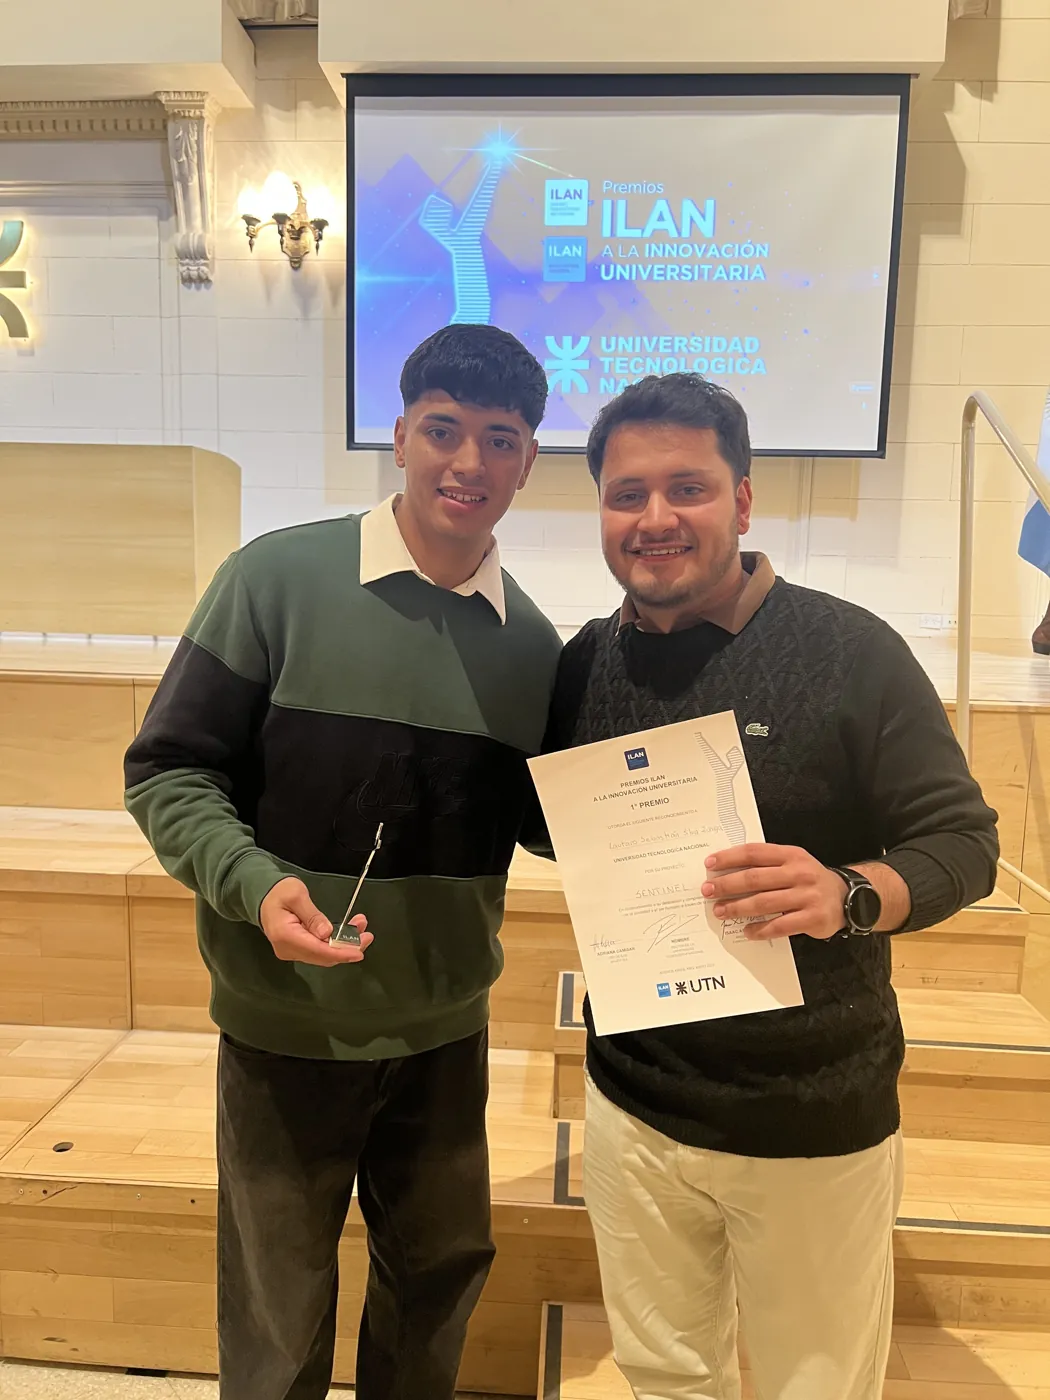
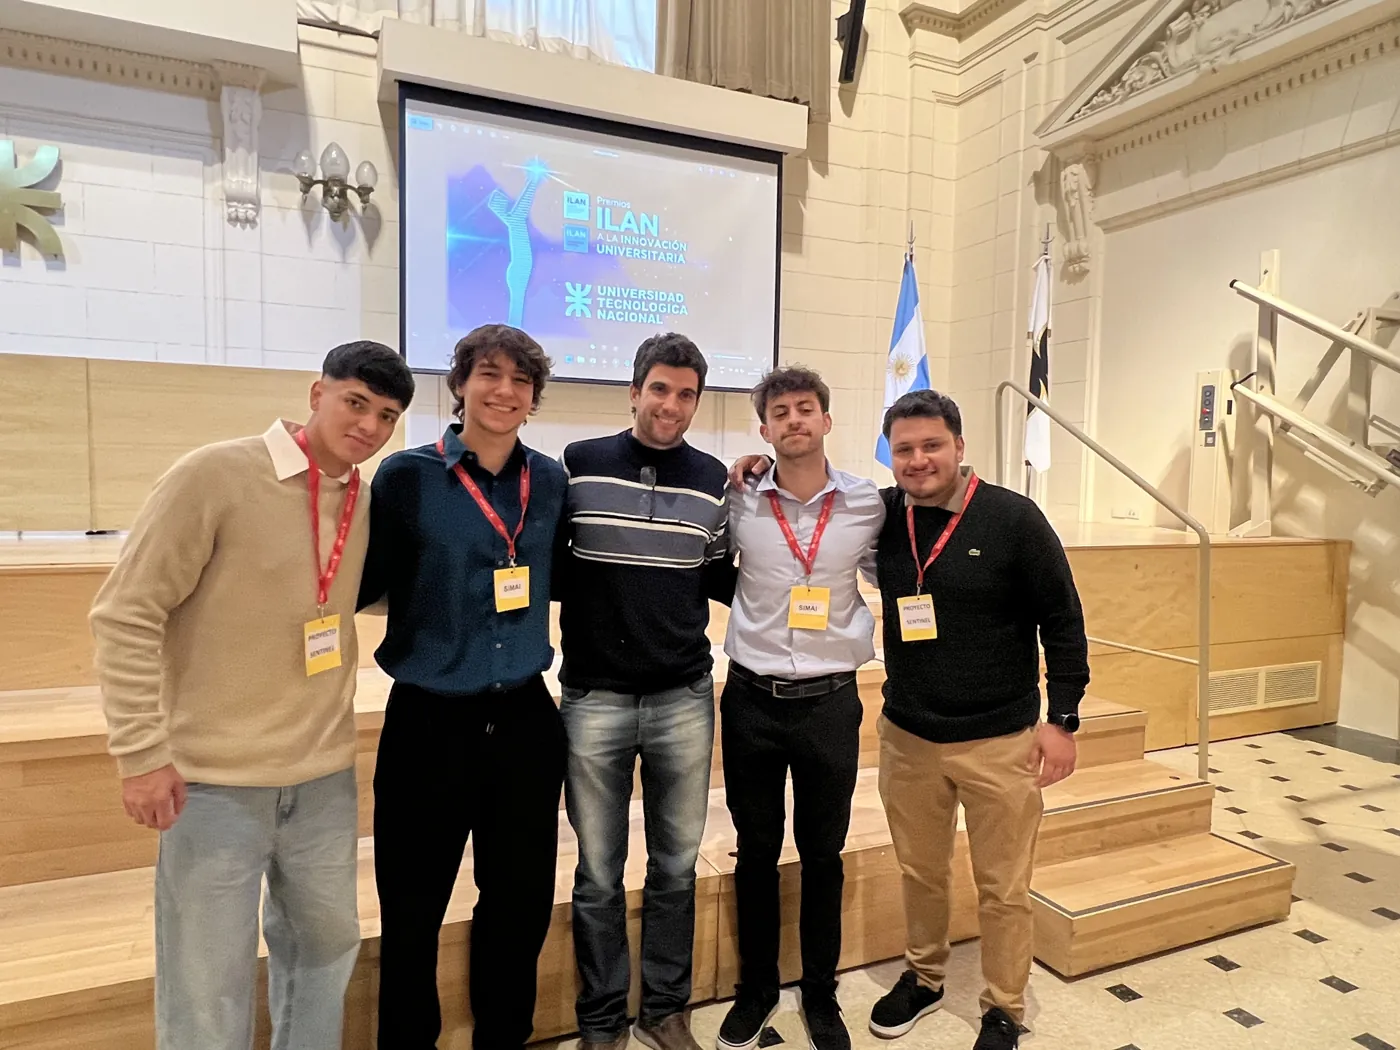
03 / 062025
We won
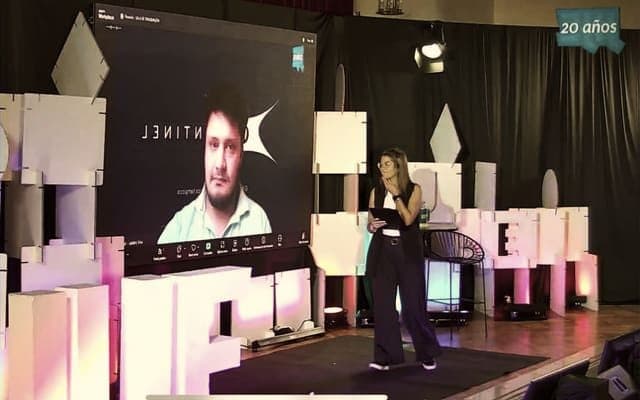
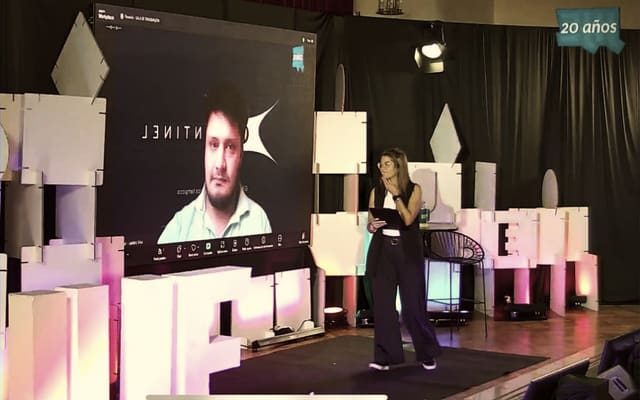
We presented remotely.

05 / 062026
We were finalists
With the Sentinel certificate and the Argentine flag on stage.
Read the article (opens in a new tab)

06 / 062026
We were finalists
Moments
Photos of the team at the competitions and events where we presented Sentinel.


Press
October 2026
 InfobaeOct 21, 2026Premios Verdes
 VistazoOct 5, 2026Premios Verdes
December 2025
 Revista DivergenteDec 15, 2025Profiles
 InfonegociosDec 12, 2025Profiles
 Diario San RafaelDec 3, 2025Profiles
November 2025
 CESSINov 27, 2025Premios Sadosky
 Canal-ARNov 27, 2025Premios Sadosky
 MediamendozaNov 27, 2025Premios Sadosky
October 2025
June 2025
 MediamendozaJun 18, 2025Premio ILAN
 Diario Río NegroJun 8, 2025Premio ILAN
 Agencia NOVAJun 2, 2025Premio ILAN
May 2025
 Diario San RafaelMay 30, 2025Premio ILAN
 Diario San RafaelMay 28, 2025Premio ILAN
 VientoSur NoticiasMay 27, 2025Premio ILAN
 InfoYaMay 27, 2025Premio ILAN
 UTNMay 22, 2025Premio ILAN
 UTNMay 22, 2025Premio ILAN
Programs and organizations we have taken part in





Home universities, competition organizers and programs Sentinel has been part of. It does not imply an agreement or commercial endorsement.
Pilot
FAQ
We read satellite data (VIIRS, MODIS y GOES-19) and combine it with geospatial information and artificial intelligence to flag likely fire hotspots and send a geolocated alert. Our accuracy target is 98%: it is a goal, not yet a result measured in the field. Today the reading is satellite-based; we are adding sensors and drones step by step.
It can happen, and it is the first question any fire brigade asks: a false alert costs time and resources. That is why the model cross-checks several sources before alerting, and that is the basis of our 98% accuracy target, which we must validate in pilots together with each client.
There is no upfront investment in equipment (CAPEX): the model points to a Sentinel Cloud subscription over the coverage you need. The price is defined according to the territory. We start with a limited pilot to validate results before a larger contract.
Our goal for a pilot is to generate alerts within 4 to 8 weeks of the start (internal estimate, to be confirmed depending on the territory). The platform is cloud-based: there is no construction or infrastructure to install on your side, you only need to define the area to cover and have internet access.
No, and we want to be clear: the risk index and the hotspot map use public sources (Open-Meteo and NASA FIRMS) for illustration, to show the same kind of variables our system processes. A client's deployment data is not public and is not shown on the website.


 UNL